Barden’s National Talent Monitor is a quarterly snapshot of Ireland’s private enterprise professional workforce, covering all major professions including accounting, engineering, analytics, administration, legal, and beyond. Collated from multiple data sources (LinkedIn data mining, CSO data, Barden data, and a third-party proprietary source), using our unique research methodologies, we identify patterns and insights that help business leaders make more informed decisions about their talent attraction and retention strategies.
#1 Key Talent Market Trends
1.1 Barden Beveridge Curve
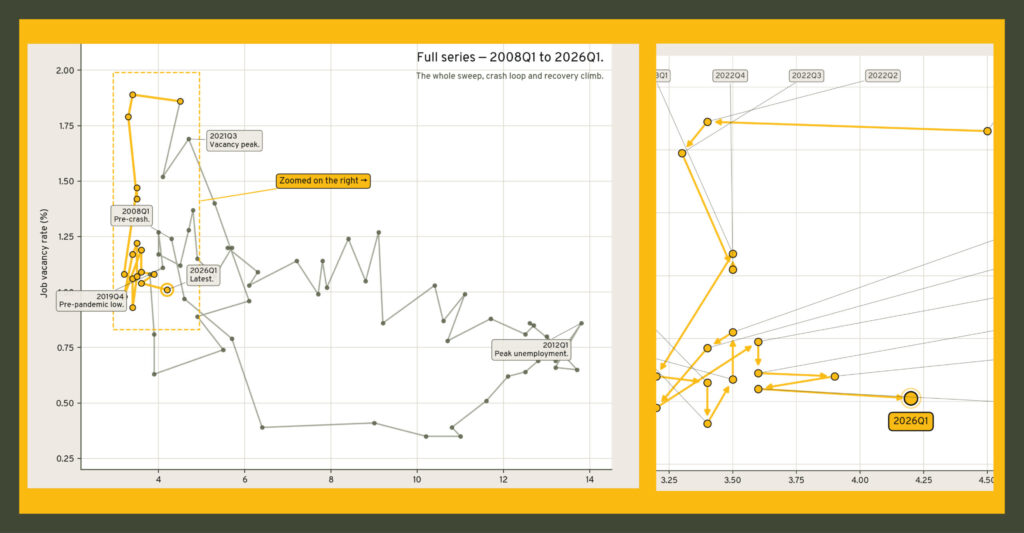
The Barden Beveridge Curve is an indicator of employment activity and talent demand in the market. It plots job vacancy rates against unemployment levels, with movements to the top left indicating higher demand for talent and movements to the bottom right indicating lower demand.
Specifically curated by Barden to represent private enterprise professionals, the curve helps track trends using CSO data, which lags quarter-on-quarter.
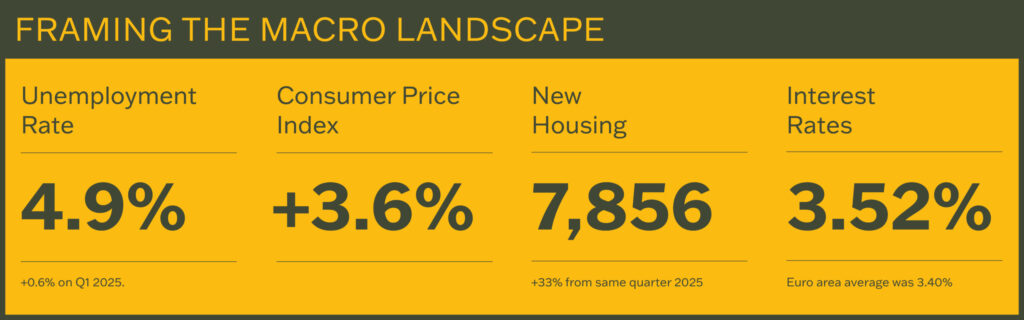
In Q1 2026, the Barden Beveridge Curve recorded its most significant single-quarter move since 2022 – the first clear signal that Ireland’s private/professional labour market has shifted out of the post-COVID ‘tight but cooling’ phase and into something genuinely looser. Unemployment in the private/professional segment ticked up to 4.2% while vacancies dipped to 1.01%, the lowest level since the COVID period. For a full analysis of what the curve is telling us, read the Barden Beveridge Curve | Q1 2026 Insights Report.
Employers who act decisively and plan strategically in the months ahead will be best positioned to secure the talent they need as market conditions evolve.
1.2 Job-Seeking Behaviour
20.1% of professionals in Ireland are demonstrating job-seeking behaviour, up 1.0 percentage point on H2 2025 (19.1%), though still significantly below the 26.1% recorded in H1 2025. In absolute terms, this represents approximately 390,000 professionals showing some level of openness to a move, compared to 360,000 in H2 2025.
This modest uptick suggests cautious optimism returning to the market after an extended period of risk aversion. While broader uncertainty, including ongoing commentary around AI productivity, geopolitical headwinds, and tariff concerns, continues to dampen mobility, the slight increase in active job-seeking behaviour indicates that some professionals are beginning to re-engage with the market.
Our Beveridge Curve analysis>>> notes that the talent-led market is fading. Well-credentialled professionals in finance, tax, legal and analytics had multiple offers and significant leverage during 2022–24, but the decline in vacancies suggests that leverage is declining. The modest rise in job-seeking behaviour is consistent with this.
1.3 Tenure and Role Changes
The median tenure for professionals remains unchanged at 1.6 years, a consistent figure now across multiple consecutive terms (H2 2024, H1 2025, H2 2025, H1 2026). This does not necessarily mean professionals are changing companies every 1.6 years; more commonly, it reflects an internal role change such as a promotion, a team move, or a broadening of responsibilities.
Leaders should consider this when planning promotions, development, and succession strategies.*
1.4 Gender Balance
Workforce participation in this cohort has returned to 43% female and 57% male in H1 2026, a small change from 42%/58% recorded in H2 2025. It is worth noting that disparities exist across professions and seniority levels.*
1.5 Talent Movement Trends
Ireland’s professional workforce has grown to 1,944,621, up 2.97% on H2 2025. However, the rate of net inflows of international talent continues to slow. In 2025, the workforce grew by approximately 6,623 net professionals, down from ~11,000 in 2024, a 40% reduction in net inflows. This trend warrants close monitoring, as it may indicate that Ireland is becoming a less competitive international destination for professional talent.
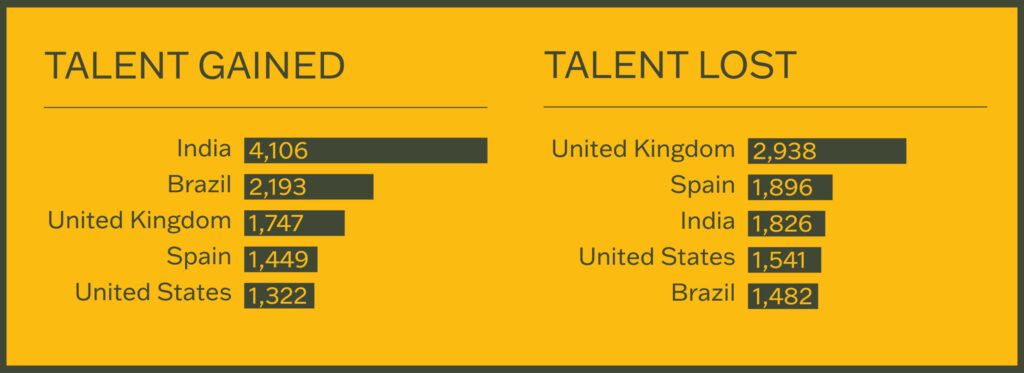
Notably, Australia has dropped out of the top five destinations for outbound talent. This is a notable change from prior periods when it consistently appeared in both the H2 2025 and H1 2025 top-five lost lists. This may suggest a normalisation of post-pandemic mobility patterns or a shift in the competitive attractiveness of destinations.
Structural factors, including cost-of-living pressures, the housing crisis, and the relative tax burden on high earners, are likely influencing inflow competitiveness. These factors do not require alarm, but they do require explicit monitoring by organisations and policymakers alike.
#2 Trends in Work Arrangements and Benefits
2.1 Hybrid Work as the Norm
Hybrid working is now firmly established as the standard model. In H1 2026, 51.1% of roles operate on a three-day in-office basis, up from 45.8% in H2 2025, with combined two-to-three day hybrid accounting for the clear majority of professional roles nationally.
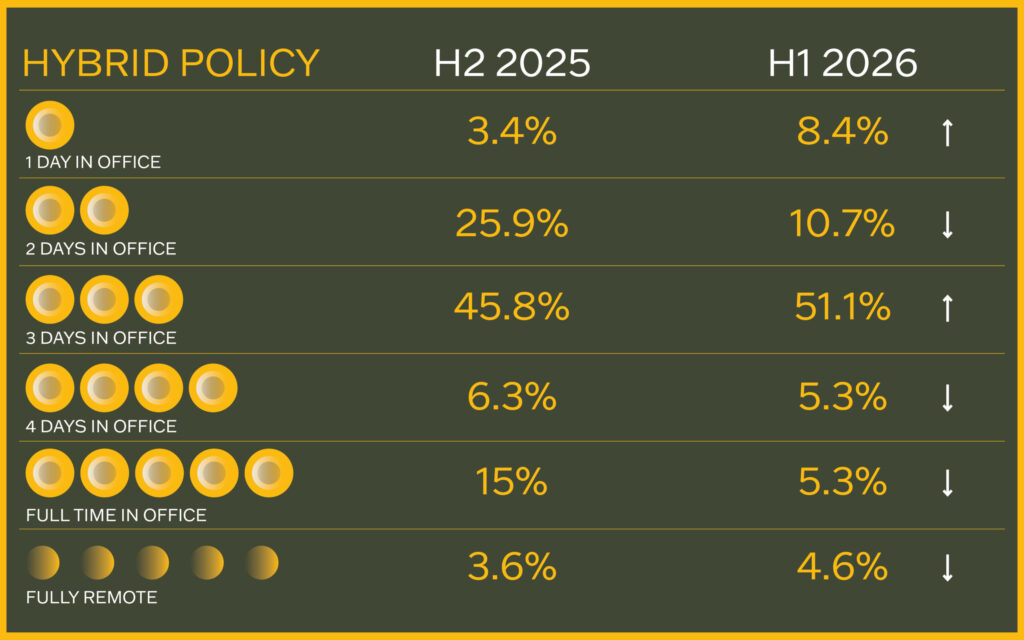
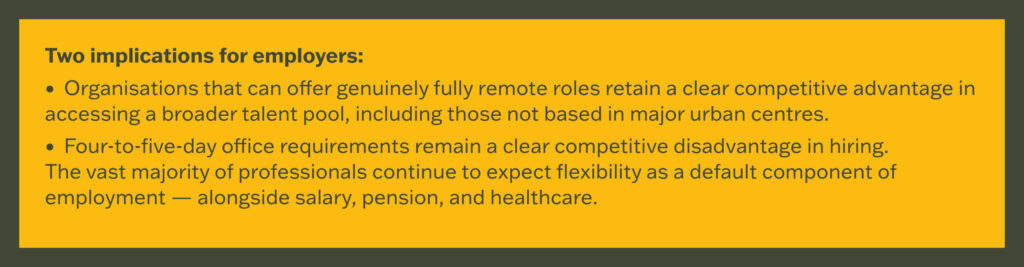
The direction of travel is toward more in-office time, not less. The most significant shift is the reduction in full-time office requirements, from 15.0% in H2 2025 to 5.3% in H1 2026. This suggests that organisations that maintained or imposed full-time mandates have either moderated their approach or found themselves at a structural disadvantage in attracting talent.
2.2 Reward Packages
Across Ireland, the most common annual leave offering remains 25 days (mode).
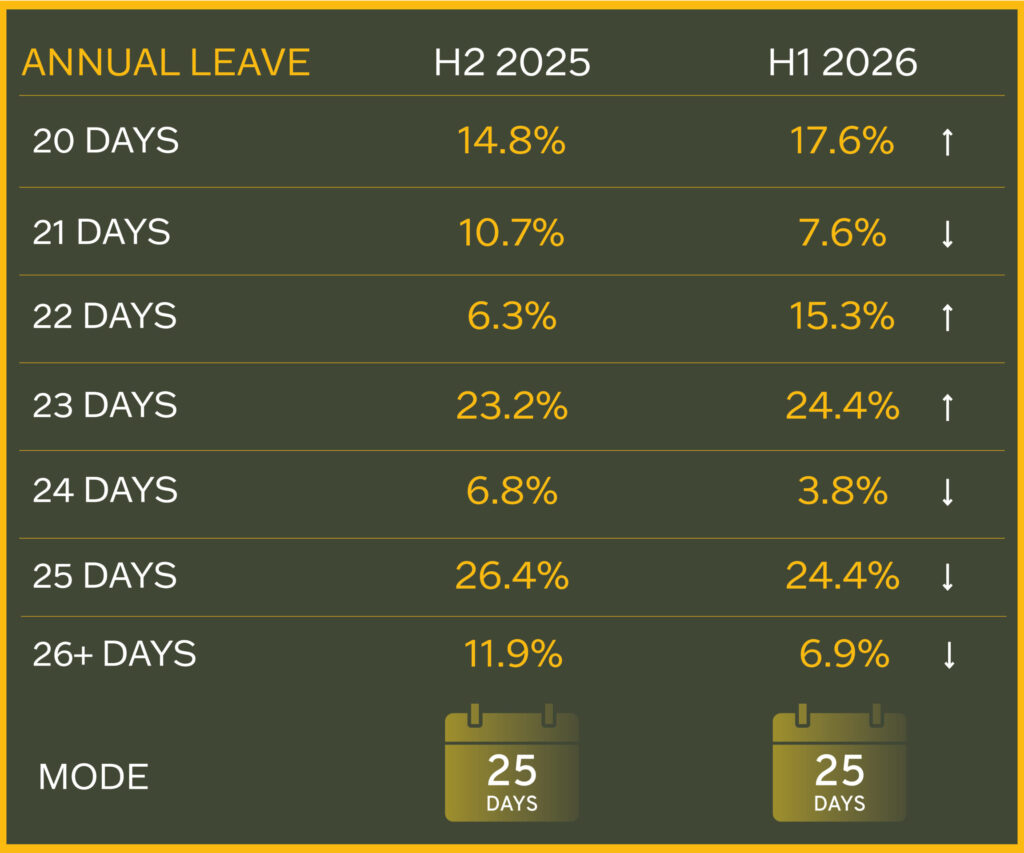
The distribution in H1 2026 shows a notable increase in organisations offering the statutory minimum of 20 days, as well as a rise in 22-day offerings. The share of organisations offering 26+ days has declined.
Offering 23–25 days or more remains critical. Anything less puts organisations at a meaningful disadvantage in attracting and retaining professional talent.
The most frequent employer pension contribution remains 5% and the most common bonus remains unchanged at 10%. Healthcare provision has declined nationally: 53.4% of roles include healthcare in H1 2026, down from 59.3% in H2 2025. This is a trend worth monitoring, as healthcare remains a valued component of professional reward packages, particularly when competing with larger multinational employers.
It is important to note that standard benefit packages vary significantly between SMEs and multinational companies, and national averages should be interpreted in the context of your specific talent market.
#3 Are you shaping your Talent Strategy?
The above data provides valuable national-level insights, but competition for talent is typically local rather than national. While understanding the macro perspective is essential, it should be complemented with real-time, localised, peer-to-peer comparisons to assess your organisation’s true competitiveness for talent and inform strategic decision-making. For example, a large multinational group function will typically not be competing for the same talent as a local SME in a given location.
This is where Barden can help you. We offer over 20 profession-specific talent monitors, such as for early-career accountants or data analysts, that provide real-time, quarter-by-quarter insights. While some of this data is publicly available here>>>, bespoke analysis remains key to effectively shaping your talent strategy.